


Hodnotenie knihy
Parametre
- 358 stránok
- 13 hodin čítania
Viac o knihe
Data is constantly increasing, making it challenging to organize in a way that resonates with its audience. Imagine visualizing data to maximize its potential and tell a clear, concise story. Thanks to Nathan Yau, a data visualization expert, this is possible. In this full-color guide, Yau provides step-by-step tutorials on how to visualize and narrate stories with data. He covers gathering, parsing, and formatting data, along with designing high-quality graphics that reveal patterns, outliers, and relationships. Yau offers a unique perspective on visualizing data, drawing from his expertise and the resources available at flowingdata.com. The book includes practical design tips for creating statistical graphics, geographical maps, and information design, helping readers find meaning in numbers. It details various tools for visualizing data-native graphics for the web, including ActionScript, Flash libraries, PHP, and JavaScript, as well as tools for print graphics like R and Illustrator. With numerous examples and descriptions of patterns and outliers, this guide demonstrates how to visually explain data, enabling you to present information in an accessible and engaging manner.
Vydanie


Nákup knihy
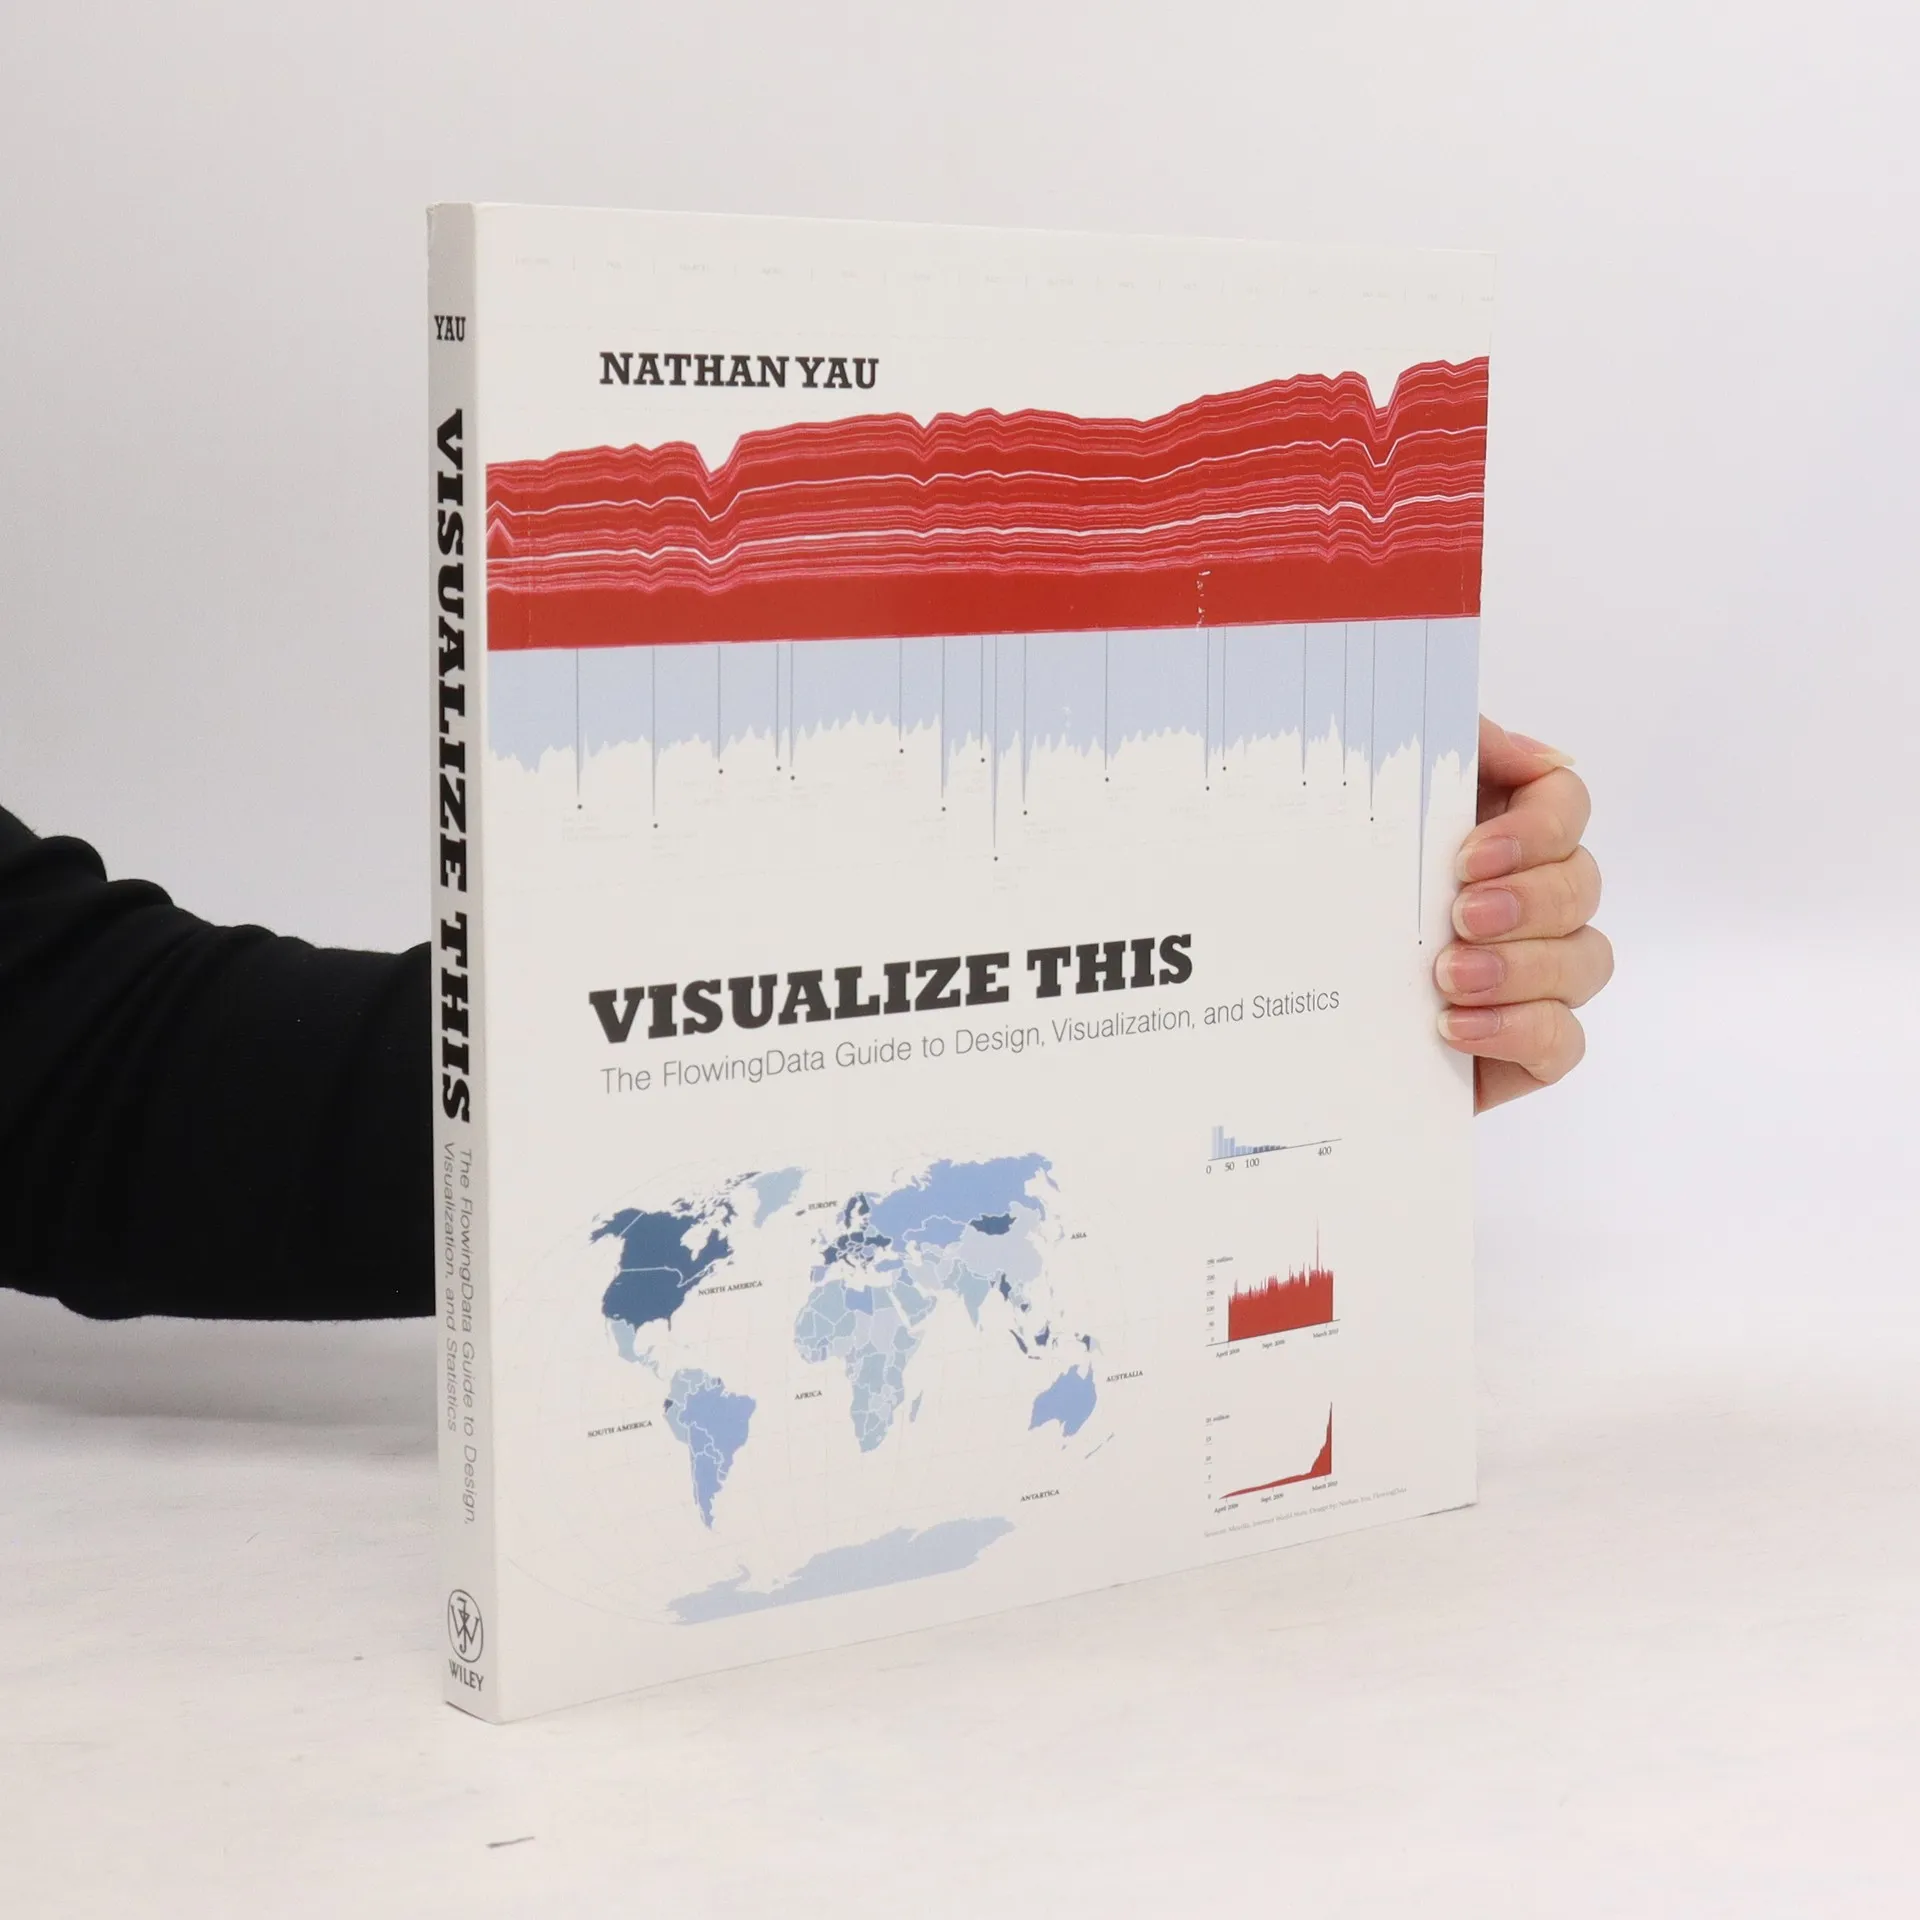
Visualize this. The FlowingData guide to design, visualization, and statistics, Nathan C. Yau
- Jazyk

- Rok vydania
- 2011
- product-detail.submit-box.info.binding
- (mäkká)
Platobné metódy
Tu nám chýba tvoja recenzia
- Titul
- Visualize this. The FlowingData guide to design, visualization, and statistics
- Jazyk
- anglicky
- Autori
- Nathan C. Yau
- Vydavateľ
- Wiley
- Rok vydania
- 2011
- Väzba
- mäkká
- Počet strán
- 358
- ISBN10
- 0470944889
- ISBN13
- 9780470944882
- Série
- Štítky
- Náučná literatúra, Umenie & Kultúra, Učebnice, Byznys, Biznis & Manažment, Technológie & Priemysel, Príručky a návody, Počítače & Internet, Veda, Technológia, Design, Marketing & Predaj, Manažment & HR, Postgraduálne štúdium
- Hodnotenie
- 3,9 z 5
- Anotácia
- Data is constantly increasing, making it challenging to organize in a way that resonates with its audience. Imagine visualizing data to maximize its potential and tell a clear, concise story. Thanks to Nathan Yau, a data visualization expert, this is possible. In this full-color guide, Yau provides step-by-step tutorials on how to visualize and narrate stories with data. He covers gathering, parsing, and formatting data, along with designing high-quality graphics that reveal patterns, outliers, and relationships. Yau offers a unique perspective on visualizing data, drawing from his expertise and the resources available at flowingdata.com. The book includes practical design tips for creating statistical graphics, geographical maps, and information design, helping readers find meaning in numbers. It details various tools for visualizing data-native graphics for the web, including ActionScript, Flash libraries, PHP, and JavaScript, as well as tools for print graphics like R and Illustrator. With numerous examples and descriptions of patterns and outliers, this guide demonstrates how to visually explain data, enabling you to present information in an accessible and engaging manner.